Background
Fleet operators manage thousands of electric vehicles, and the battery is the most expensive part of each one. A battery that fails without warning means a vehicle off the road, an unhappy driver and a costly emergency repair. Most fleets already collect daily telemetry, but that data sits in spreadsheets that nobody has time to read.
Problem
Fleet managers need to know which batteries are likely to fail, how much life each one has left, and why. A risk score on its own is not enough: if people cannot see the reason behind a prediction, they do not trust it and they do not act on it.
Approach
I applied the same rule I use for UX work: start with the user’s questions, not the technology. A fleet manager asks three things every morning: “What changed?”, “Who do I need to look at today?” and “Why?” Every part of the agent answers one of those questions.
Results
Trained on 20,000 vehicles and tested on 4,000 it had never seen:
- Failure prediction (ROC-AUC)
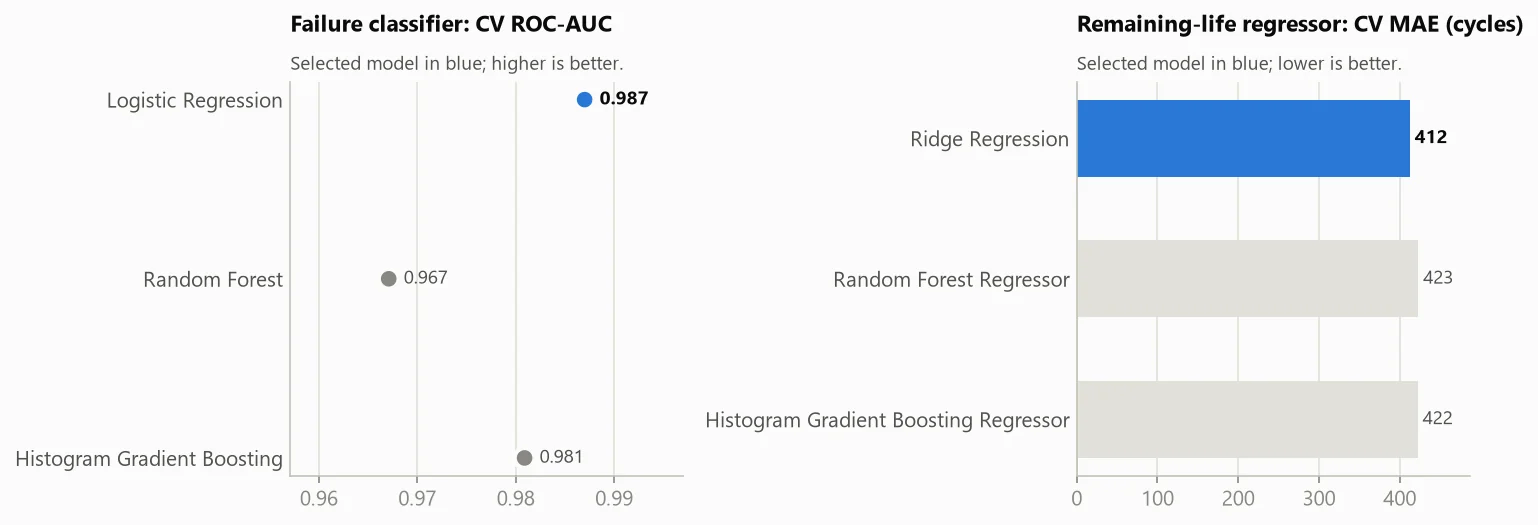
- 0.985
- Failures caught
- 84%
- Precision of alerts
- 75%
- Remaining-life fit (R²)
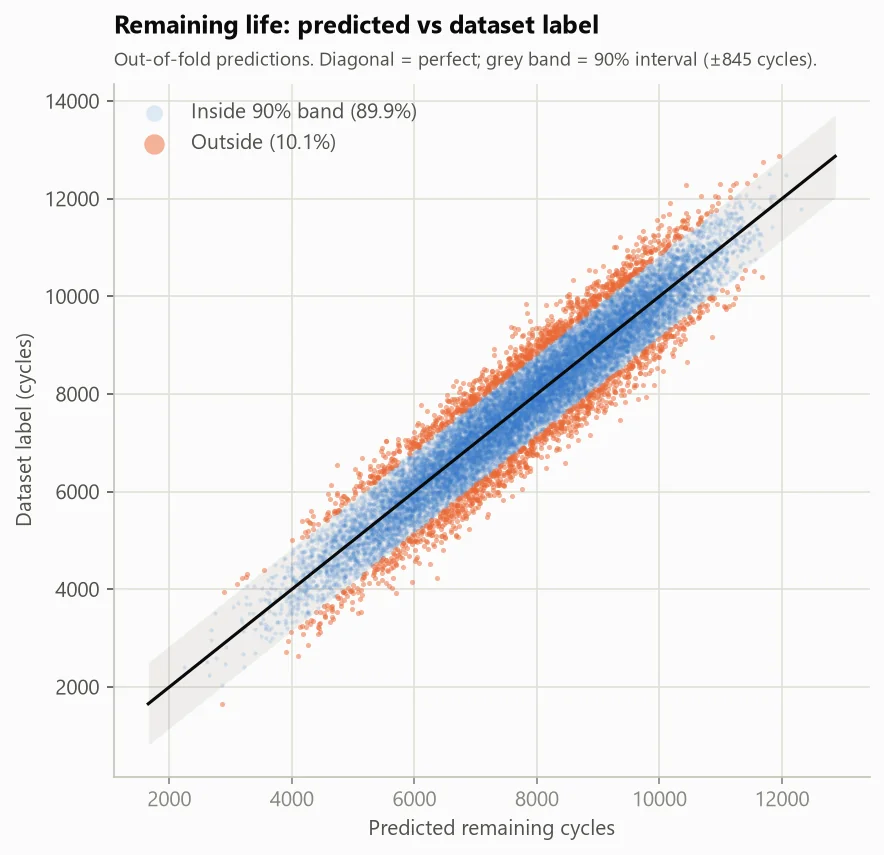
- 0.906
The remaining-life estimate comes with a 90% range that held 90.0% of the time on the test set. Everything except the optional agent mode runs offline, with no API key.
What I built
- Prediction: failure probability with a risk band, and remaining life in cycles, kilometres or days, with a calibrated 90% range.
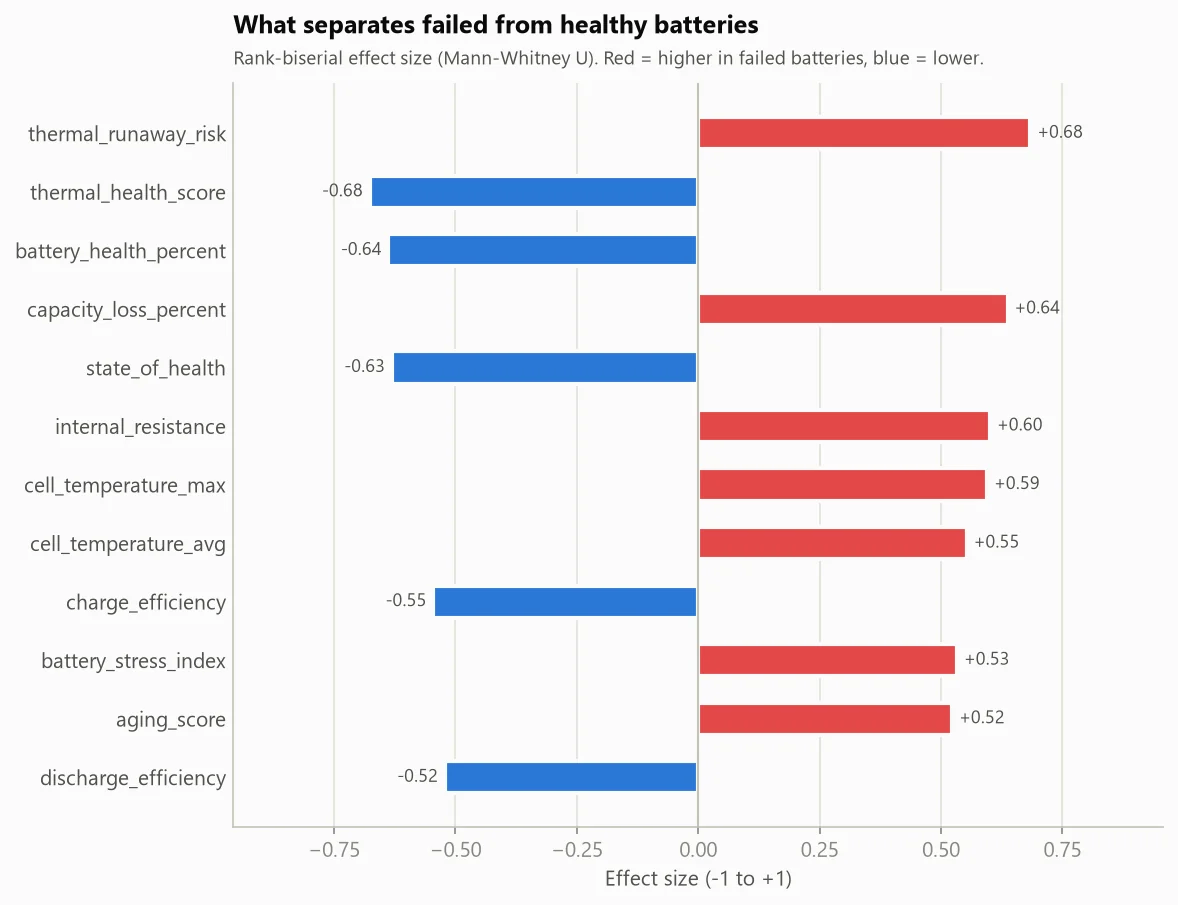
- Explanation: for every vehicle, the factors that drive its risk, plus charts, outliers and the reason one model was chosen over the others.
- Daily intake: takes in the fleet’s daily export (CSV, Excel, JSON or Parquet), maps the columns, and checks the data for gaps, bad values and drift.
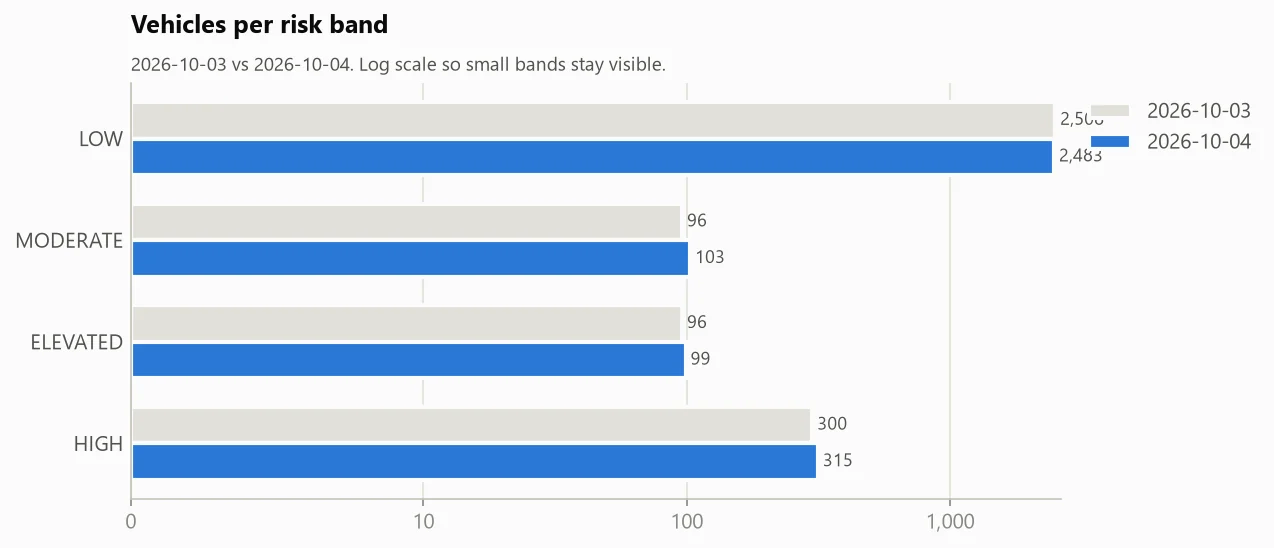
- Reports and alerts: daily and weekly reports with an action list, alerts by email, Slack or Teams, and a dashboard that refreshes on every intake.
- Learning loop: recorded outcomes (“failed”, “false alarm”) become training labels. A new model goes live only if it beats the current one.
- Agent mode: Claude plans the analysis with 20 tools, reads its own charts and explains the results in plain language.
Showing the why
Every number the agent reports comes with the evidence behind it. These charts come straight from the agent’s own reports.
Takeaways
Trust is a design problem. The most useful feature was not the model’s accuracy but the explanation next to each number. A decision log and a “Needs review” section make every run auditable, so a manager can check the agent’s work instead of taking it on faith.